

CBIM - European Training Network
Geometric Data Collection
| Motivation
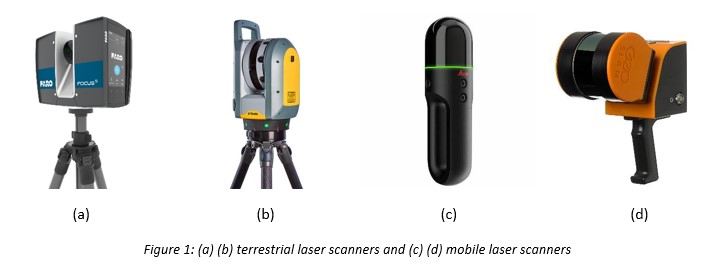
One of the fundamental principles of Cloud-BIM is that they reflect the properties of physical assets. When it comes to the as-is geometry of a facility, the industry requires reliable methods of surveying current conditions concerning the geometry and techniques to transfer this information into the digital environment. This article aims to give a brief motivation for reality capture techniques, an overview of methods to collect geometrical data, and the roadmap of further steps for processing point clouds and generating geometrical models of buildings or other assets. One of the use cases for reality capture is digitising assets that do not have any reliable geometry models, which is usually the case for existing buildings. This is the case for 63 per cent of buildings currently in service in the UK that were built more than 20 years ago (GOV.UK, 2020, 2021) and do not have a design model (NBS Enterprises, 2020). Their drawings are often outdated or unreliable representations of the physical asset. Therefore, the generation of the geometry of existing assets usually requires capturing geometric data. This is less an issue with recently constructed buildings; however, these can often be poorly documented. Geometry is a core part of the building data and a prerequisite in the broader asset digitisation process. It is required to perform various activities during the operation and maintenance stage. For instance, 3D models can be used to perform energy consumption optimisation with simulations (Sanhudo et al., 2018), schedule and maintenance optimisation (Chen et al., 2018), predictive maintenance (Bosché et al., 2015), etc. These applications allow to reduce operational expenses but rely on the precision of the geometric data. Reality capture technologies for data collection is also considered as a core step to support BIM geometry updating for all kinds of assets, including buildings, bridges, highways, and roads. One of the greatest challenges faced by the architecture, engineering, and construction industry is poor project performance due to lack of timely progress monitoring and quality control during the construction stage. Keeping BIM geometry dynamic by detecting and recording the as-built geometry data of assets from the on-site collected point clouds along with images can facilitate automating and standardising progress monitoring and quality control. By comparing survey data at regular intervals against design models, variation can be detected in the as-built and incorporated into the as-constructed BIM either manually or using semi-automated commercial tools such as ClearEdge 3D’s Verity software. Point cloud collection a. background The generation of geometry for Cloud-BIM should rely on objective knowledge about the current conditions of an asset. The data produced by a scanning device should reflect the real world; therefore should be obtained directly from the physical object's surface. Due to the nature of all capturing techniques, the data provided by scanners is not continuous but discrete. This means that the output of reality capture does not give object surfaces but gives only a small set of observations sampled from these surfaces. Laser scanners and other scanning methods provide point clouds that are set of points in 3D space. Each point is defined by three coordinates and additional information, which is usually the brightness or RGB colour of a point. Later, this section gives an overview of two methods for point cloud acquisition: laser scanning and videogrammetry. b. Laser scanning: introduce types of scanners Basically, there are two types of laser scanners: terrestrial laser scanner (Figure 1 (a) (b)) and mobile laser scanner (Figure 1 (c) (d)). Many leading companies such as Faro, Leica, Riegl, and Trimble, offer a range of functional scanners.
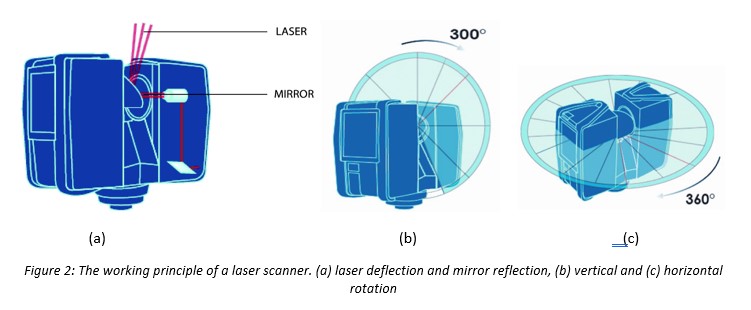
The terrestrial laser scanner (TLS) is also called the long-range laser scanner or the tripod-mounted laser scanner, which is often employed to generate point clouds of vast outdoor spaces and large buildings. It can measure points from a long distance (e.g. in tens or hundreds of meters) with high precision to support construction and industry activities, including surveying, site inspection, and building information modelling. By contrast, the mobile scanner must be handheld or mounted on a vehicle to capture point cloud data. The accuracy of mobile laser scanners (the precision deviation is normally around 1~3 cm) (Sepasgozar et al., 2018) is lower than the terrestrial scanners, but the capturing speed is competitively faster in practice. The working principle of the laser scanner can be summarised as the laser infrared technology-based point collection. The scanner emits a beam of infrared laser light onto a rotating mirror that effectively paints the surrounding environment with light to capture millions of discrete data points to produce detailed 3D images. During the scanning, the scanner head rotates to sweep the laser across the object or area. Then, objects in the path of the laser reflect the beam back to the scanner, providing the geometry that is interpreted into 3D data in space (Figure 2).
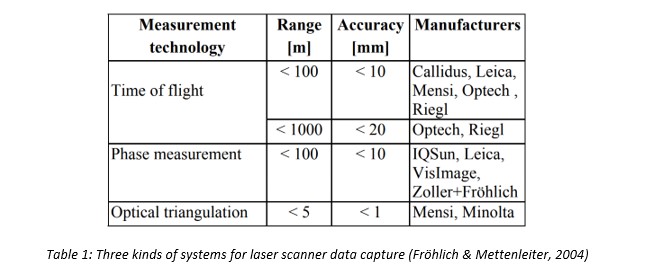
A laser scanner typically captures data through three kinds of systems: 1) Time-of-flight system; 2) Phase-shift system; and 3) Optical triangulation. Table 1 summarises these three systems as different measurement principles.
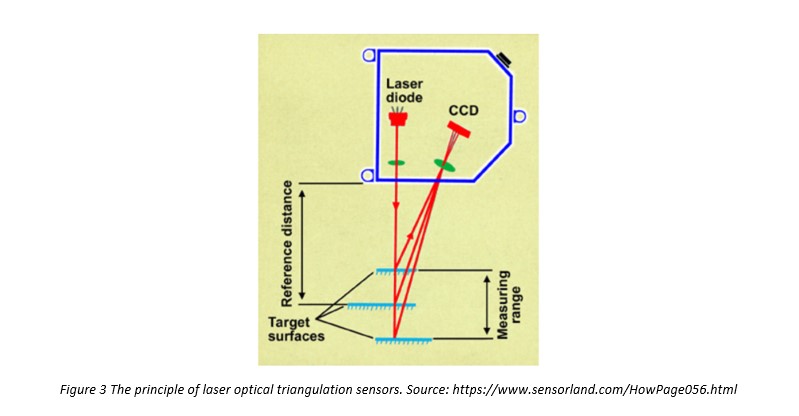
The time-of-flight system is also known as a pulse measurement system. It works by emitting a single pulse of laser light and determining the distance to the point by measuring the time it takes for the light to be reflected back to a sensor on the scanner. The phase-shift system also needs to emit laser light, but the difference from the first system is that the intensity of the light is modulated with specific wave forms. The reflection of the intensity patterns is displaced by the impact on the surface of the object. It can produce more accurate, faster, and higher-resolution point cloud data. Finally, optical triangulation sensors measure distance by searching for the optimal angle between the emitted laser beam and the received beam (Figure 3). This angle depends on the distance to the surface and the distance between the emitter and the receiver. This system provides much more accurate measurements on short distances only, which makes it practical in surveying small (but important) objects.
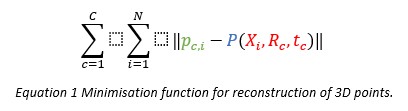
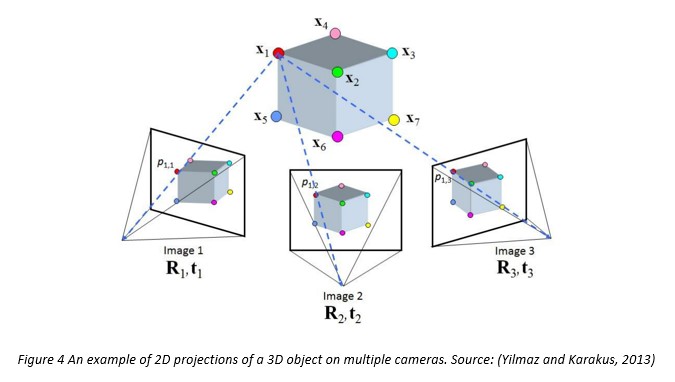
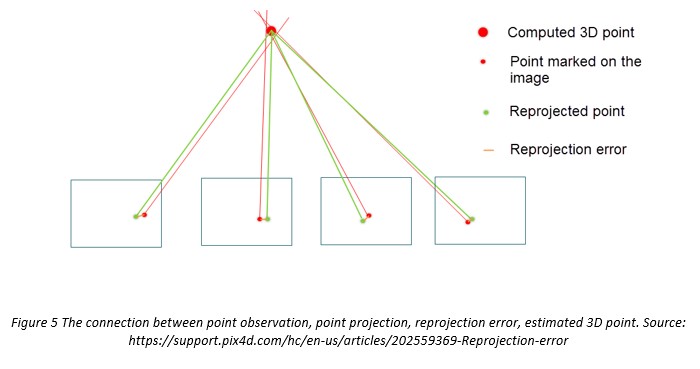
c. Videogrammetry In contrast to laser scanners, which are active sensors (they beam electromagnetic waves), videogrammetry restores 3D information from a video. It recovers the 3D position of a point in space by tracking distinct 2D features on multiple frames and jointly calculating the 3D positions of points on images as well as camera movement. This mimics how animals perceive the world with eyes, which provide only 2D information. The nature of this point cloud capturing method assumes using of cheaper devices (an RGB camera is enough) but lower quality of the output. To give a bit more explanation on how videogrammetry works, let's look at the example of a few consecutive frames (Figure 4). In the first step, we identify distinct features, which are located on colour discontinuities (such as corners). We then match features representing the same point in 3D space on different images (for example, using SIFT descriptor (Lowe, 1999)). Having this information (; ; …) and knowing how a 3D point is projected to an image (blue-dashed lines, P(X, R, t)), we can estimate what error (distance between projection and observed point) would a given point produce for a given camera location.
The nature of videogrammetry methods assumes that all detected points are located where the colour changes. This entails that this method of point cloud capturing is not able to capture points on regions with homogeneous colour. For example, all distinct features of the walls are on their borders. Therefore, videogrammetry can detect only wall boundaries but not the wall surface itself. This contrasts with laser scanners, which can provide measurements for arbitrary directions. In addition, the spatial accuracy of laser scanners is higher. Post-processing Just like eyes looking around scenes, the scanner cannot capture all parts of an asset into one file. Typically, a terrestrial scanner needs to be placed on various sites of an asset in order to obtain enough data of different scenes. It takes around 10 minutes to complete each scanning for each site. Therefore, there will be a number of files containing different raw point clouds with various coordinate systems and noisy data (e.g. trees for the building façade scanning outsides, movable furniture in the indoor scanning, etc.). In order to represent the whole asset in a clear, direct way, users need to post-process these raw point cloud datasets. The post-processing of raw point cloud datasets includes registration, denoising, and density normalisation. The results of post-processing are highly dependent on the worker's experience. First, each point cloud file needs to be registered together into a common 3D coordinate system to reflect the whole status of the building Software including Autodesk Recap and Faro Scene can be used to register the raw point cloud datasets into one file (Figure 6). Recap can also crop PCD and denoise the outliers. CloudCompare is a free software that can register and denoise the raw PCD clusters, but Recap is better for large-scale point cloud datasets with higher performance and faster speed based on the authors' experience. At the next step, density normalisation aims to optimise the density of point clouds to normalise the size of files to facilitate activities at the construction and operation stages. Density normalisation includes upsampling, downsampling, and filling holes in the point cloud. Upsampling refers to increasing the density of a point cloud. Many state-of-the-art techniques, including PU-net (Yu et al., 2018), DUP-Net (Zhou et al., 2019), and Zero-Shot algorithm (Zhou et al., 2021) can upsample with a high speed and little computational complexity. Similarly, downsampling tries to make point clouds sparser since the size of some files is quite big. VoxelGrid filter from the point cloud library (Pomerleau et al., 2013) is a popular method to achieve downsampling. Also, some approaches have already been applied in practice, such as MATLAB point cloud toolbox. Finally, filling gaps can improve the performance of point clouds. A gap can be defined as any inconsistency in the point clouds. Therefore, a gap can exist as a hole inside of the surface represented by the point cloud or as the truncation on the boundary of the point cloud. Many reasons can cause gaps in the point clouds, including occlusions, insufficient coverage of the scene, building object instance connections, and possible calibration errors. Typically, there are two steps to fill holes in the point cloud: 1) determining boundaries of holes, and 2) smoothly covering the hole and reconstructing missing parts using available data (Rashidi et al., 2013). On the other hand, these two steps cannot be directly used to fill the holes without boundaries (defined as truncation) in the point cloud. Therefore, another good solution for filling holes in point clouds is to use the prior knowledge from the design intent (e.g. as-designed BIM) if it is available.
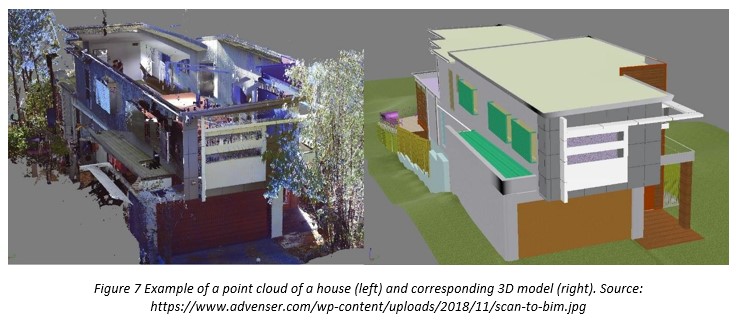
Post-processed point clouds are still highly unordered data with a tremendous level of detail and a lot of redundant data. It entails that this data type cannot be used for actions mentioned in the beginning since point clouds do not contain any semantic information. These have to be transformed into a structured 3D model with information about individual objects, their parameters, and their relations (Figure 7). In spite of a number of commercial solutions for semi-automatic geometry generation from point clouds, such as EdgeWase 3D, Faro as-built, Leica cyclone, among others, this process still requires substantial manual effort.
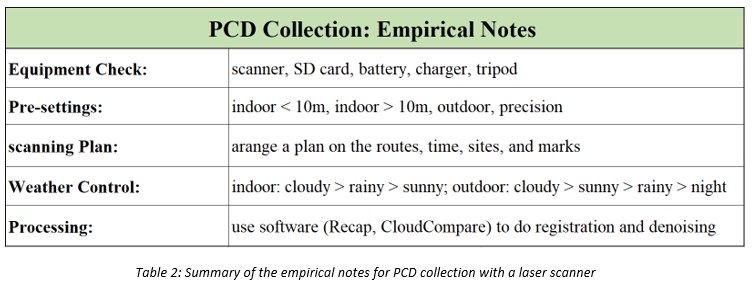
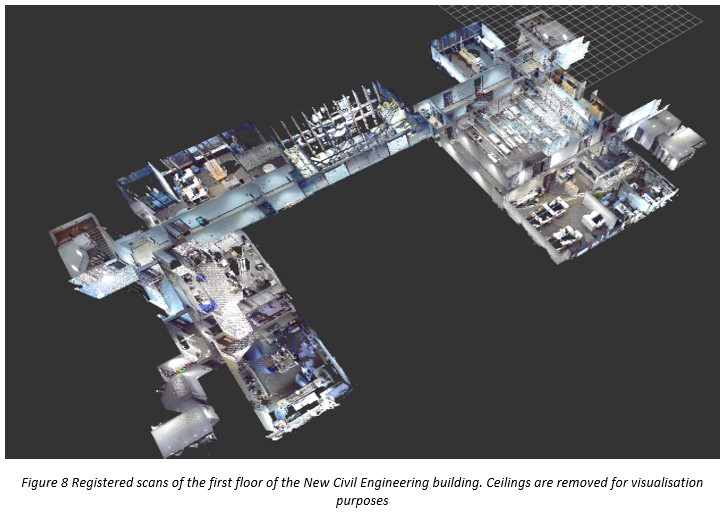
Case study: Scanning in Civil Engineering Building at Cambridge The authors carried out a case study by collecting point clouds of the Civil Engineering Building at the University of Cambridge with a terrestrial laser scanner. The equipment used was a FARO Focus 3D X330 Terrestrial Laser Scanner (2013) (ranging error at , self-levelling: accuracy (range )). The Civil Engineering Building has three storeys that required around 52 hours and 205 scans for most building parts (without a basement under the ground floor). Table 2 shows the empirical notes of PCD collection. After data collection, the authors used Recap to register point clouds of the second floor of the building (Figure 8). It took around 9 hours to finish the registration of raw PCDs semi-automatically. Overall, based on this case study, terrestrial laser scanning is a time-consuming work for a large building. Skilled experts can do a better job on the accuracy of collected data since they have more experience in preparing a scanning plan before the task and post-processing the collected data. Nevertheless, this technology can help AEC industry (e.g., construction workers, progress surveyors, etc.) to better control the performance of a project throughout its lifecycle.
References: https://info.vercator.com/blog/the-most-popular-laser-scanners-for-creating-point-clouds https://www.aniwaa.com/buyers-guide/3d-scanners/terrestrial-laser-scanners-long-range/ https://www.g2metric.co.il/product/faro-laser-scanner-focus-s70/ https://www.faro.com/en/Resource-Library/Article/understanding-laser-scanners https://shop.leica-geosystems.com/blk2go-overview https://www.sensorland.com/HowPage056.html Fröhlich, C., & Mettenleiter, M. (2004). Terrestrial laser scanning–new perspectives in 3D surveying. International archives of photogrammetry, remote sensing and spatial information sciences, 36(Part 8), W2. Yu, L., Li, X., Fu, C. W., Cohen-Or, D., & Heng, P. A. (2018). Pu-net: Point cloud upsampling network. In Proceedings of the IEEE Conference on Computer Vision and Pattern Recognition (pp. 2790-2799). Zhou, H., Chen, K., Zhang, W., Fang, H., Zhou, W., & Yu, N. (2019). Dup-net: Denoiser and upsampler network for 3d adversarial point clouds defense. In Proceedings of the IEEE/CVF International Conference on Computer Vision (pp. 1961-1970). Zhou, K., Dong, M., & Arslanturk, S. (2021). " Zero Shot" Point Cloud Upsampling. arXiv preprint arXiv:2106.13765. Pomerleau, F., Colas, F., Siegwart, R., & Magnenat, S. (2013). Comparing ICP variants on real-world data sets. Autonomous Robots, 34(3), 133-148. Rashidi, A., Brilakis, I., & Vela, P. (2013). Built infrastructure point cloud data cleaning: an overview of gap filling algorithms. In International Conference on Construction Applications of Virtual Reality. Bosché, F., Ahmed, M., Turkan, Y., Haas, C.T. and Haas, R. (2015), "The value of integrating Scan-to-BIM and Scan-vs-BIM techniques for construction monitoring using laser scanning and BIM: The case of cylindrical MEP components", Automation in Construction, Vol. 49, pp. 201–213. Chen, W., Chen, K., Cheng, J.C.P., Wang, Q. and Gan, V.J.L. (2018), "BIM-based framework for automatic scheduling of facility maintenance work orders", Automation in Construction, Vol. 91, pp. 15–30. GOV.UK. (2020), "Non-domestic rating: stock of properties including business floorspace, 2020", GOV.UK, available at: https://www.gov.uk/government/statistics/non-domestic-rating-stock-of-properties-2020 (accessed 30 July 2021). GOV.UK. (2021), "Construction statistics annual tables - Office for National Statistics", available at: https://www.ons.gov.uk/businessindustryandtrade/constructionindustry/datasets/constructionstatisticsannualtables (accessed 20 August 2021). Lowe, D.G. (1999), "Object recognition from local scale-invariant features", Proceedings of the Seventh IEEE International Conference on Computer Vision, Vol. 2, presented at the Proceedings of the Seventh IEEE International Conference on Computer Vision, pp. 1150–1157 vol.2. NBS Enterprises. (2020), "NBS BIM Report 2020". Sanhudo, L., Ramos, N.M.M., Poças Martins, J., Almeida, R.M.S.F., Barreira, E., Simões, M.L. and Cardoso, V. (2018), "Building information modeling for energy retrofitting – A review", Renewable and Sustainable Energy Reviews, Vol. 89, pp. 249–260. Yilmaz, O. and Karakus, F. (2013), "Stereo and kinect fusion for continuous 3D reconstruction and visual odometry", pp. 115–118. Sepasgozar, S. M., Forsythe, P., & Shirowzhan, S. (2018). Evaluation of terrestrial and mobile scanner technologies for part-built information modeling. Journal of Construction Engineering and Management, 144(12), 04018110. |

 Zhiqi Hu Zhiqi HuESR 3 Updating model geometry from registered point cloud and image datasets |
 Viktor Drobnyi Viktor DrobnyiESR 1 Infrastructure objects detection based on cascaded deep learning architectures enhanced with design priors |
 Conor Shaw Conor ShawESR 6 Data fusion for operational optimisation and facility management |
| < Previous post |